KIP Survey Data Tools
SOURCE: Kentucky Incentives for Prevention (KIP) Survey
KIP Data Summary Dashboard (2004-2021) and KIP Data Visualizer (2004-2021)
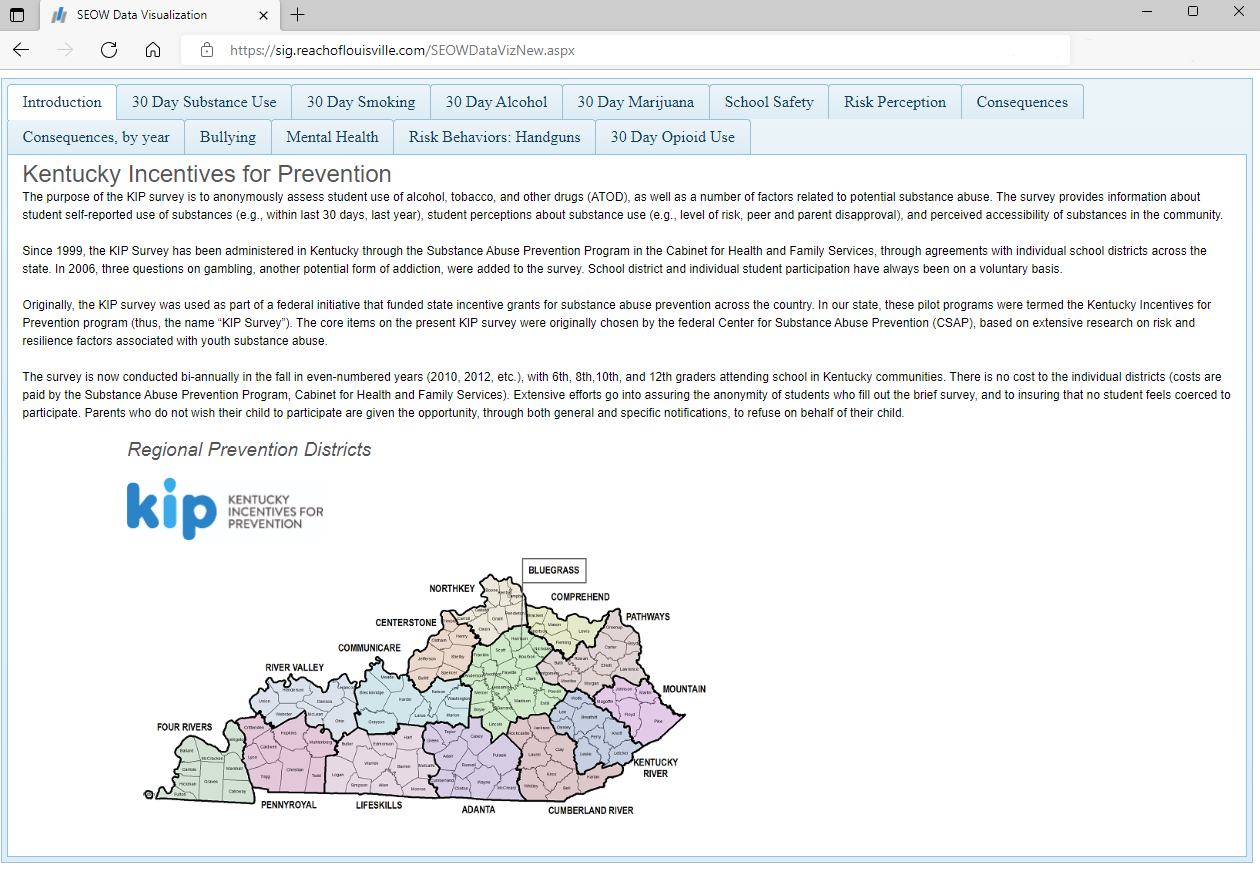
REACH has developed two dynamic tools useful for analyzing KIP Survey data on a regional and statewide-level. The KIP Data Summary Dashboard and the KIP Data Visualizer allow users to track and display key data indicators utilizing survey results from 2004-2021. Click on the images below to explore each tool.
*Please note that due to significant changes in administration procedures and participation rates, 2024 KIP data will not be added to the KIP Data Dashboard or the KIP Data Visualizer.
2021 KIP Survey Data Dashboards
The 2021 KIP Survey included the addition of several critical new items to address impacts of the COVID-19 pandemic, impacts of the racial justice movement, experience of race-based discrimination, and experiences associated with vaping. To explore this new data in detail, the following dashboards have been created as a resource for local coalitions, prevention professionals, community mental health centers, youth advocates and others working on prevention efforts at the state, regional, or community levels in Kentucky. Users can create grade-level breakdowns to view several indicators within each category. A key at the bottom of the page explains the abbreviations representing race/ethnicity groupings.


